• Latest
Map Shows States with Highest Levels of Tiny, Toxic Air Pollution

Map Shows States with Highest Levels of Tiny, Toxic Air Pollution

July 25, 2025
Mother Updates on Inventor Son Julian Brown After Going Dark

Mother Updates on Inventor Son Julian Brown After Going Dark

July 29, 2025

Republic Wireless: Managing Different Phones on the Same Billing Cycle

July 28, 2025

The request could not be satisfied.

July 28, 2025
8 Ways to Generate Passive Income with Cryptocurrency

8 Ways to Generate Passive Income with Cryptocurrency

July 28, 2025
Money Matters: Master Your Financial Future

Money Matters: Master Your Financial Future

July 28, 2025
### Accounting For Photographers: Important Tips

### Accounting For Photographers: Important Tips

July 28, 2025

Controversy Erupts Over Voter Roll Revision in Bihar

July 28, 2025
The Importance of Emergency Funds and How to Build Yours

The Importance of Emergency Funds and How to Build Yours

July 28, 2025
Financial Literacy Matters: Here’s How to Boost Yours

Financial Literacy Matters: Here’s How to Boost Yours

July 28, 2025
Understanding XRP’s Role in the Future of Money Transfers

Understanding XRP’s Role in the Future of Money Transfers

July 28, 2025
Build Your Unique Online Shop!

Build Your Unique Online Shop!

July 28, 2025
Protect Your Business with This Insurance Strategy

Protect Your Business with This Insurance Strategy

July 28, 2025
DailyWise
  • Home
  • Environment
  • LifeStyle
  • Inspiration
  • Health
No Result
View All Result
DailyWise
  • Home
  • Environment
  • LifeStyle
  • Inspiration
  • Health
No Result
View All Result
DailyWise
No Result
View All Result
Home Environment

Map Shows States with Highest Levels of Tiny, Toxic Air Pollution

by
July 25, 2025
in Environment
0
Map Shows States with Highest Levels of Tiny, Toxic Air Pollution
Share on FacebookShare on Twitter

Login to Continue Learning

Create Your Student Account

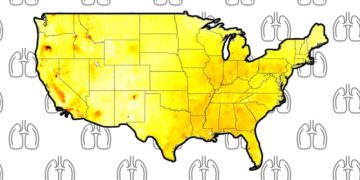
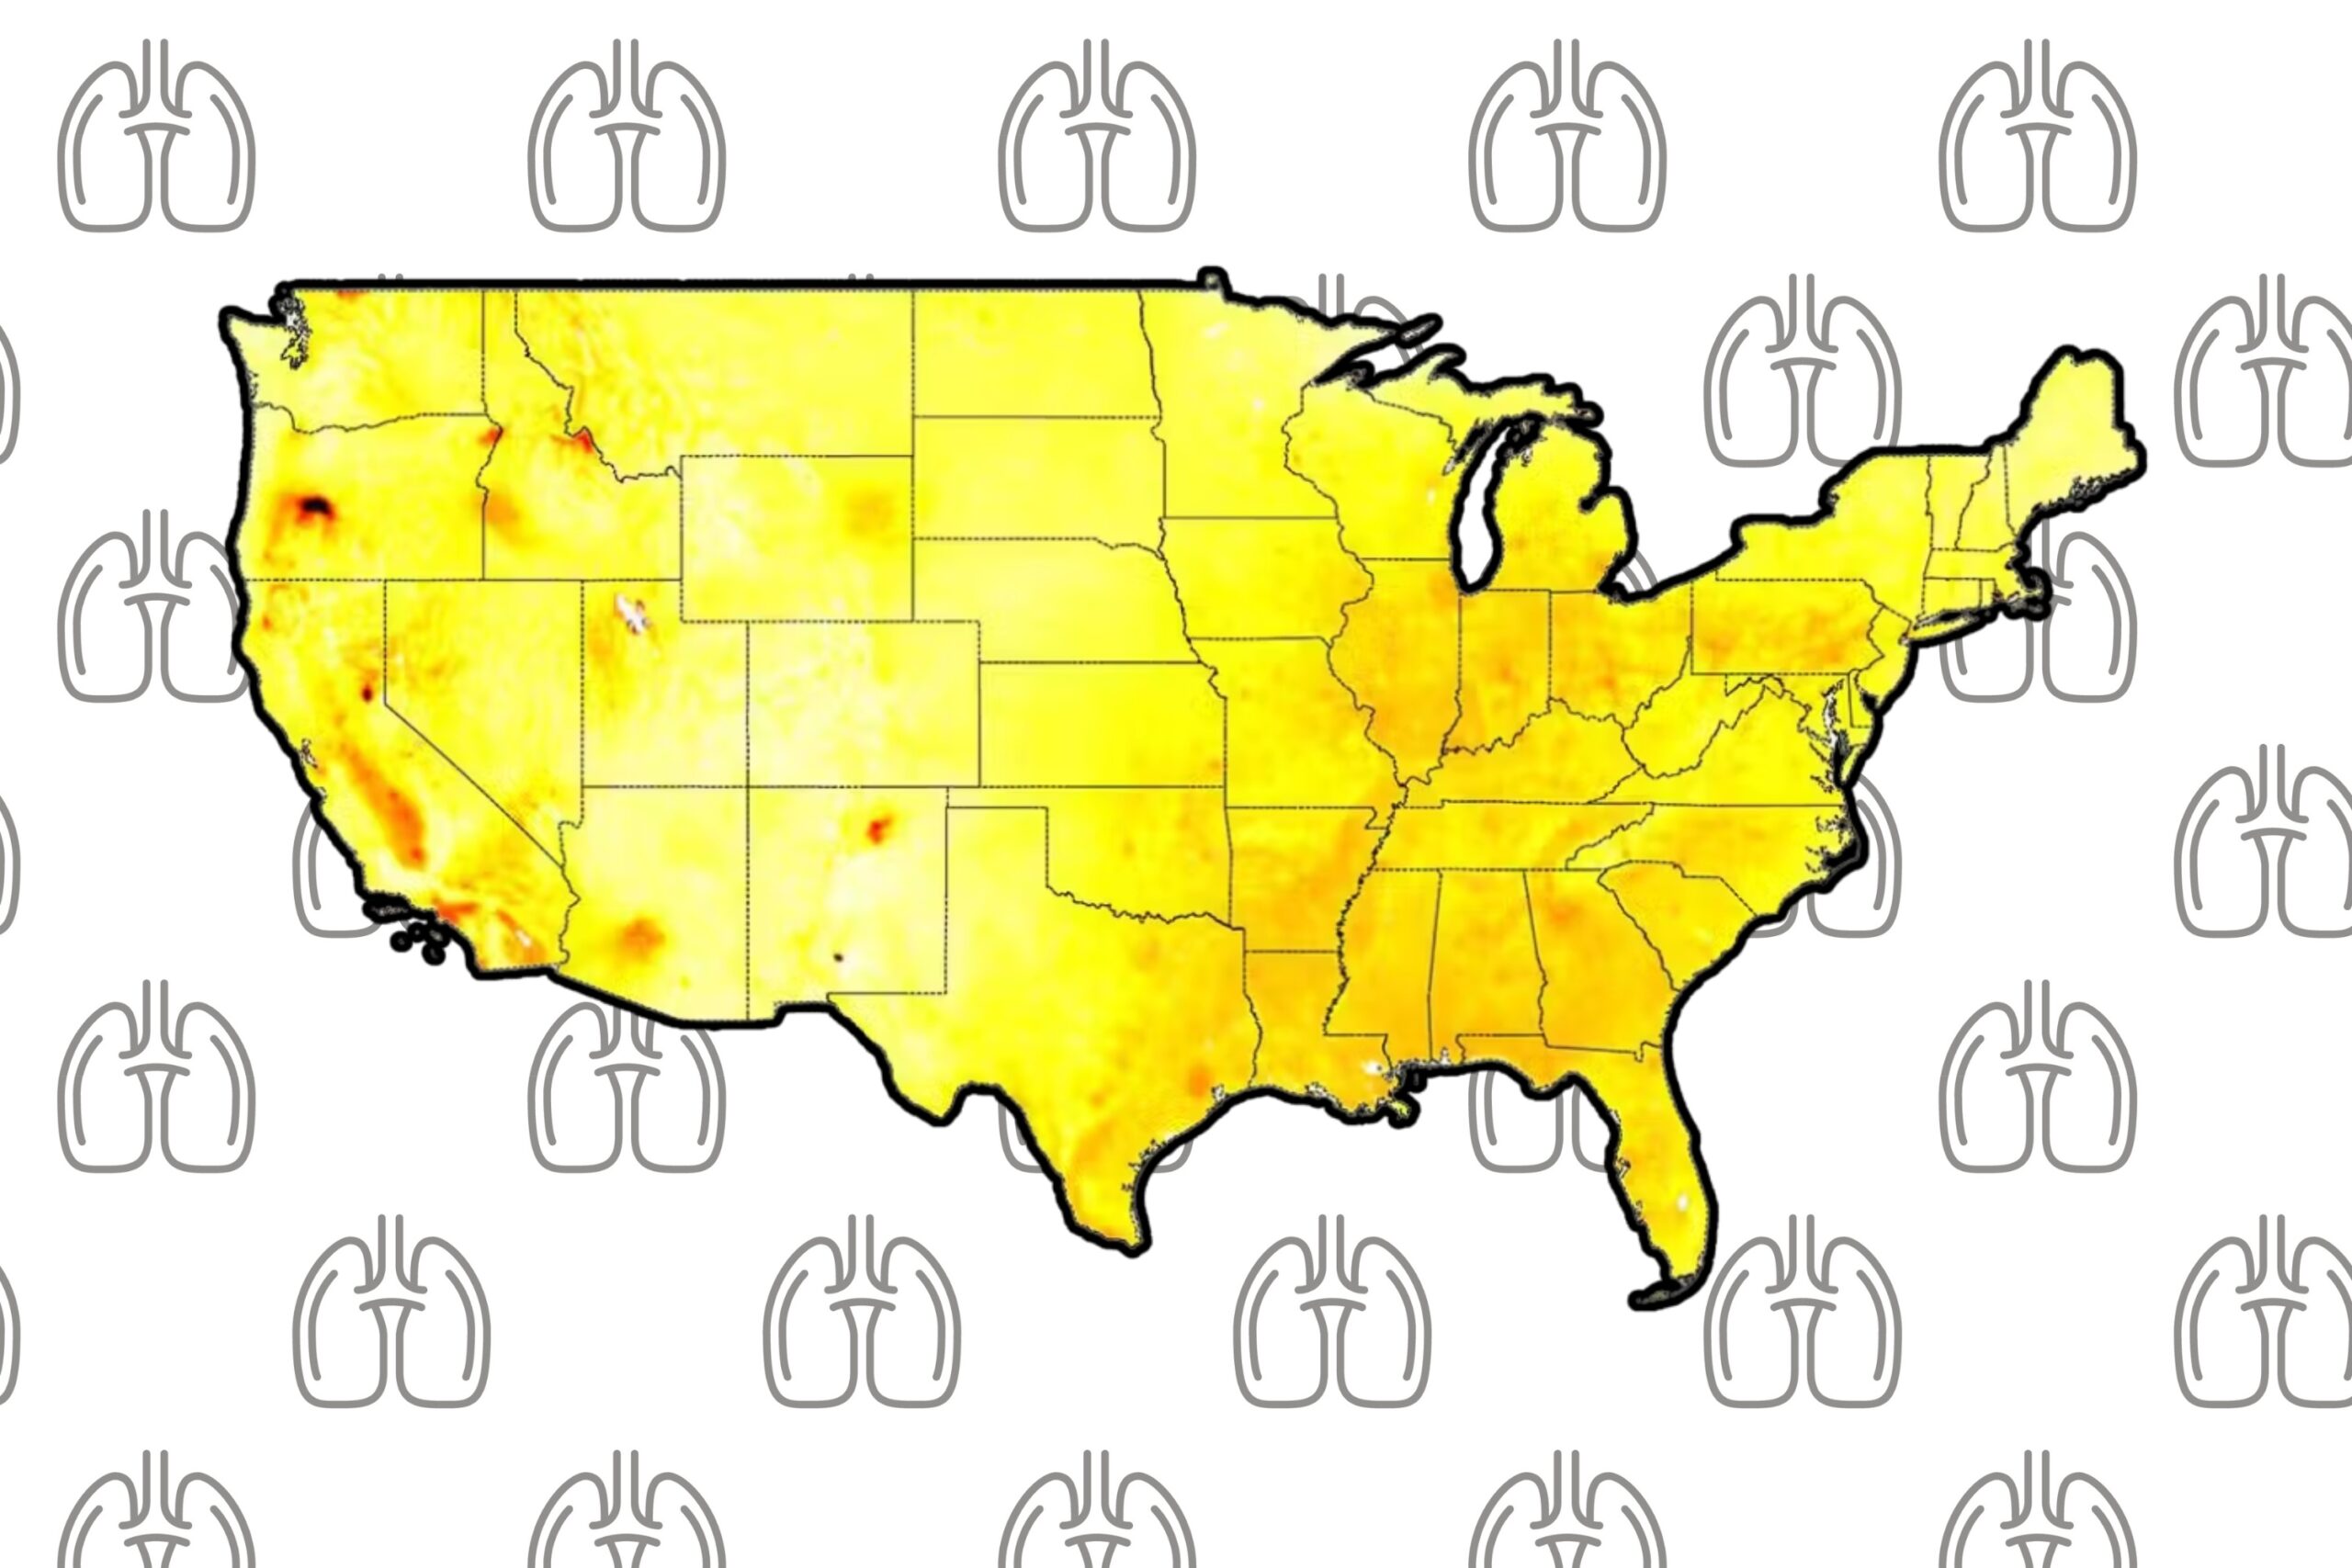
California and Oregon are among the U.S. hotspots for dangerous submicron (PM1) air pollution—particles smaller than a micron or one millionth of a meter wide, according to new research from Washington University in St. Louis.

The researchers have been quantifying submicron particle levels across the country over the past 25 years. Data calculated based on known ratios of PM2.5 (particulate matter less than 2.5 microns) suggest that many eastern areas contain hotspots.

Due to their small size, PM1 pollutants can bypass the body’s defenses and cause even worse health effects. Parts of Arizona, California, Idaho, New Mexico, Oregon, and Texas show higher concentrations of submicron particulate matter on the researchers’ map, indicated by darker red areas.

Conversely, Colorado, Montana, Utah, and Wyoming have far fewer dark patches, suggesting lower levels of submicron particles. Arizona and New Mexico exhibit high concentration levels in some areas but much lower levels elsewhere within their states.

Related Post

Mother Updates on Inventor Son Julian Brown After Going Dark

Mother Updates on Inventor Son Julian Brown After Going Dark

July 29, 2025

Republic Wireless: Managing Different Phones on the Same Billing Cycle

July 28, 2025

The request could not be satisfied.

July 28, 2025

8 Ways to Generate Passive Income with Cryptocurrency

July 28, 2025

Higher PM1 concentrations were found in major urban and industrial areas and regions affected by wildfires, highlighting the role of combustion sources in producing harmful particles. This contrasts with the arid western states, which generally show lower concentrations.

The World Health Organization (WHO) suggests that 99 percent of the global population breathes air containing high levels of pollutants, exceeding WHO guidelines. Combined ambient and household air pollution are linked to 7 million premature deaths annually.

Exposure to particle pollution can cause heart attacks, irregular heartbeat, aggravated asthma, decreased lung function, and difficulty breathing, according to the Environmental Protection Agency (EPA).

Assistant research professor Chi Li, who led the study, notes that small particles often come from direct air emissions like black carbon from diesel engines or wildfire smoke. PM1 can also form through secondary processes involving sulfur dioxide or nitrogen oxides from fuel combustion and coal burning.

The dataset reveals a sharp drop in PM1 levels from 1998 to 2022, attributed to regulations such as the Clean Air Act of 1970.

For further information on science stories or air pollution questions, contact Newsweek at science@newsweek.com.

📚 Reading Comprehension Quiz

10 Points

Which U.S. states are highlighted in the research as having higher concentrations of submicron particulate matter (PM1)?

Please login or register to take the quiz and earn points!

Related Posts

Mother Updates on Inventor Son Julian Brown After Going Dark
Environment

Mother Updates on Inventor Son Julian Brown After Going Dark

by
July 29, 2025
Business & Finance

Republic Wireless: Managing Different Phones on the Same Billing Cycle

by
July 28, 2025
Business & Finance

The request could not be satisfied.

by
July 28, 2025
Next Post

Thailand Warns Full-Scale War with Cambodia Over Border Clashes

Leave a Reply Cancel reply

Your email address will not be published. Required fields are marked *

Recent Posts

  • Mother Updates on Inventor Son Julian Brown After Going Dark
  • Republic Wireless: Managing Different Phones on the Same Billing Cycle
  • The request could not be satisfied.

Categories

  • Business & Finance
  • Environment
  • Event
  • Health
  • Inspiration
  • LifeStyle
  • Politics
  • Science
  • Technology
  • Uncategorized
  • World

© 2025 JNews - Premium WordPress news & magazine theme by Jegtheme.

...
►
Necessary cookies enable essential site features like secure log-ins and consent preference adjustments. They do not store personal data.
None
►
Functional cookies support features like content sharing on social media, collecting feedback, and enabling third-party tools.
None
►
Analytical cookies track visitor interactions, providing insights on metrics like visitor count, bounce rate, and traffic sources.
None
►
Advertisement cookies deliver personalized ads based on your previous visits and analyze the effectiveness of ad campaigns.
None
►
Unclassified cookies are cookies that we are in the process of classifying, together with the providers of individual cookies.
None
No Result
View All Result
  • Home
  • Leaderboard
  • Support Forum
  • Pre-sale Question
  • About
  • Contact
  • Register

© 2025 JNews - Premium WordPress news & magazine theme by Jegtheme.