


Login to Continue Learning
Since the 1940s, companies have used PFAS (perfluoroalkyl and polyfluoroalkyl substances) to make products like Teflon nonstick pots, waterproof rain gear, stain-resistant carpets, and firefighting foam. These chemicals resist heat, oils, stains, grease, and water, making them useful but also persistent in the environment and human body.
Studies suggest that PFAS can contribute to health issues such as thyroid disease, liver damage, kidney cancer, and testicular cancer. In 2024, the U.S. Environmental Protection Agency (EPA) concluded there is no safe level of exposure for two common PFAS compounds: perfluorooctanoic acid (PFOA) and perfluorooctanesulfonic acid (PFOS). The EPA set drinking water standards to limit these compounds.
However, PFAS exposure isn’t just through drinking water. It can also come from food, recreational activities, and industrial emissions. We examined four pathways: drinking water contamination, food contamination, recreational exposure, and industrial emissions in Michigan, New York, and Pennsylvania.
Our interactive map and online dashboard let residents look up their communities’ known PFAS exposure risks and calculate their own risk. The results offer insights for people across the U.S. with similar environments, dietary choices, and lifestyles.
Related Post


PFAS Exposure Patterns
PFAS have widespread presence due to improper disposal of products containing these “forever chemicals.” They are in farm fields, drinking water, and water bodies where fish and shellfish can ingest them. We found that on average, people consume about three times more PFAS through food than through drinking water.
We looked at 19 food items with detected PFAS, including seafood like clams, crab, and shrimp, which have the highest levels. Other foods may also expose people to PFAS, so our totals likely underestimate actual intake.
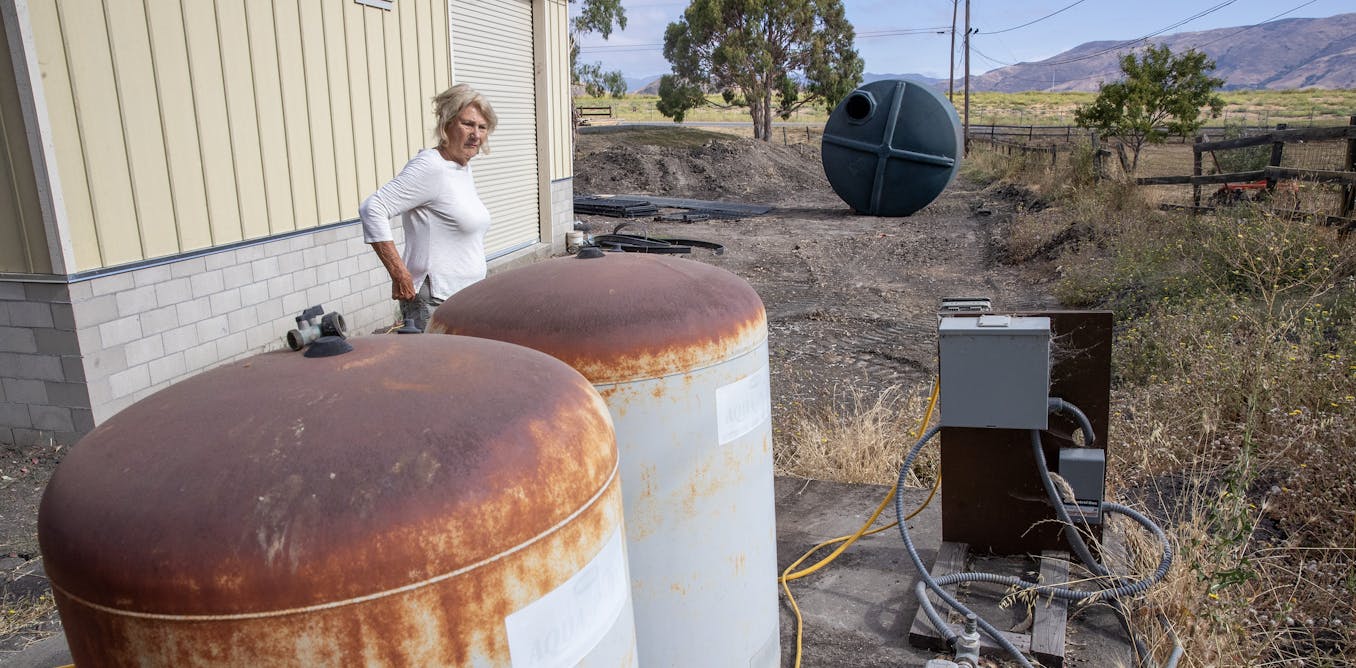
In Michigan, New York, and Pennsylvania, we found that PFAS had been detected in 1,272 out of 2,593 tested public water facilities serving about 23 million people. We also found distinct patterns of exposure:
– Among the three states, Pennsylvania has the highest risk from food and water, while Michigan has the lowest.
– Michigan’s lower risk likely reflects its significantly lower PFAS contamination in drinking water due to testing and regulation.
Notably, most dietary PFAS comes from butter, olive oil, and shrimp. Seafood typically contains much higher concentrations than butter or olive oil, but greater consumption of these products makes them significant sources of PFAS.
Intake of foods containing PFAS is higher in Pennsylvania and New York compared with Michigan, driven by greater seafood and olive oil consumption, likely reflecting Mediterranean influences.
Comparing Detroit, Philadelphia, and NYC
– Detroit has an above-average risk from food, particularly ground beef and baked tilapia. Public drinking water hasn’t been tested for PFAS.
– New York City has minimal PFAS exposure in its public drinking water but much higher in butter and olive oil due to Mediterranean cuisine influences.
– Philadelphia’s public drinking water is also at low risk, with high consumption of shrimp, bacon, and sausage.
Philadelphia and surrounding areas have a high recreational risk from PFAS exposure. Studies are beginning to understand the risks from skin exposure.
Smaller cities like Rochester, New York, also face higher recreational PFAS risks compared with other regions due to Lake Ontario contamination.
How to Reduce Your PFAS Exposure
– Use drinking water filtration systems if your public water system has high PFAS levels.
– Adjust dietary choices by eating less of foods potentially containing PFAS.
– Use our dashboard to find recreational sites near contaminated water bodies.
Our study aims to inform and empower individuals and communities to make healthier choices. Local governments and advocacy groups can use the data to prioritize policies reducing exposure.
Where to Learn More
– EPA’s online PFAS Analytic Tool shows locations of contamination in natural, drinking water systems, and industrial emissions.
– The Environmental Working Group’s map highlights PFAS-contaminated sites and affected public water systems.
These resources offer valuable insights into contamination locations but do not directly assess human exposure or individual risk. As research on PFAS continues to evolve, information is crucial for public understanding and prevention.


